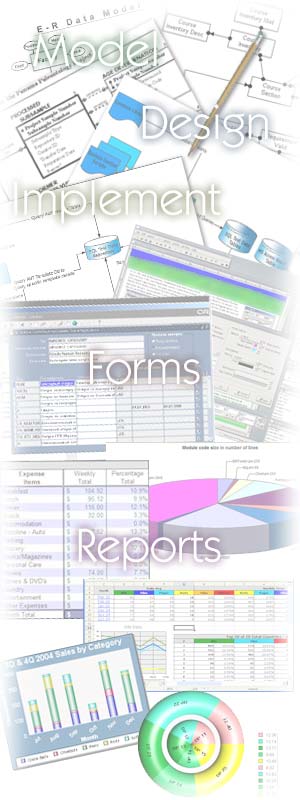
Data Analysis is one of those terms people throw around a lot that sounds very technical. It shouldn't be. You may be collecting data and not be sure of meaningful ways to look at that data. That's where help for Data Analysis comes in.
You may be using Access, or using tools much more sophisticated such as Oracle Reports or Hyperion. Regardless of your level of use, our team can help!
What data are you capturing? What are meaningful relationships in the data that can be made into useful reports?
Is it in your database? Does your data capturing system need to be adjusted in order to supply useful information?
The result of Data Analysis is ad-hoc (on the spot) reports that are not "canned" or part of the regular set of system reports.
Ad-hoc reports are specially developed to answer the questions you have about your customer base, your sales, your service, your finances, or any other aspect or activity that is recorded about your organization. There are two types of reports for Data Analysis
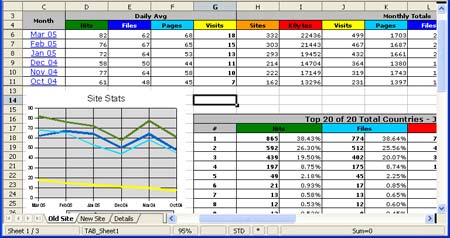
These reports give you numbers and let you see exactly what the figures were for the activity you are monitoring.
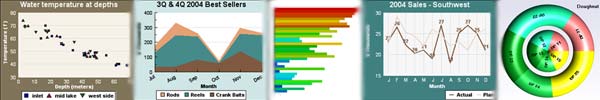
Charts and graphs allow easy comparison of data over time, by location, by person, whatever the criteria may be. Using charts it is easy to identify trends or compare performance. Charts can consist of line, bar, stacked bar, area, pie, donut or scatter design.
BizDev Technologies
6439 Louise Place NE – Albuquerque, New Mexico 87109
Off: (505) 822-1444 – Cel: (505) 550-0920 – Fax: (505) 797-3934
eMail: info@bizdevtech.com